
Amplicon sequencing & microbiome profiling
Microbiome Data Analysis Services for 16S, 18S and ITS Sequencing Projects
Understand which microbial groups are detected, explore diversity and compare communities across samples. Receive interpretable results, publication-ready figures and a report shaped around your research question.
Downstream analysis of existing FASTQ files or suitable ASV/OTU tables. DNA extraction, library preparation and sequencing are arranged separately.
Analysis capabilities
Our Microbiome Data Analysis Services
Choose a complete amplicon analysis or selected downstream steps for environmental, host-associated or engineered communities.
Quality control & preprocessing
Inspect read quality, remove primers and adapters, and select filtering suited to the marker and read layout. Tools may include Cutadapt, fastp or Trimmomatic; preprocessing is coordinated with the denoising workflow.
ASV inference & taxonomic assignment
Infer amplicon sequence variants using approaches such as DADA2, remove chimeras and assign taxonomy with a suitable reference. Resources include SILVA for ribosomal markers and UNITE for fungal ITS. Resolution depends on the marker, primers and reference coverage.
Diversity & community analysis
Explore within-sample diversity and differences between communities using suitable metrics and ordination. Analysis can use phyloseq, mia or MicrobiomeAnalyst, with methods chosen for the data and study design.
Differential abundance testing
Evaluate associations between microbial features and sample groups using methods appropriate to compositional count data. Account for supported covariates and repeated sampling, and report effect sizes and multiple-testing-adjusted results where available.
Integration with sample metadata
Relate community patterns to variables such as pH, treatment, site or host characteristics. Check sample matching, missing metadata and potential confounding before interpreting associations.
Custom analysis & reporting
Receive taxonomic summaries, diversity plots, heatmaps, ordination and comparison tables, with clear interpretation. Existing datasets can also be assessed for focused reanalysis or custom figures.
Research outcomes
What can you achieve with microbiome profiling?
Describe community composition
Profile detected bacterial and archaeal groups using 16S, fungal communities using ITS, or microbial eukaryotes using 18S, within the coverage of the chosen assay.
Compare diversity across samples
Investigate richness, evenness and community dissimilarity across sites, conditions or time points. Interpretation considers sequencing depth and the sampling design.
Investigate community associations
Identify patterns linked to environmental or experimental variables and prioritize follow-up hypotheses. Observational associations do not establish causality.
Communicate your findings
Present the evidence through labelled figures, organized tables and methods documentation, with limitations in detection and taxonomic assignment made explicit.
Research contexts
Applications of Microbiome Data Analysis
Microbiome profiling supports research across natural, host-associated and managed environments.
Environmental monitoring
Compare communities in marine, freshwater, terrestrial and built environments, and investigate associations with measured environmental conditions.
Agriculture & soil research
Explore soil and plant-associated communities across management practices, treatments or locations, including studies of biofertilizers and plant–microbe relationships.
Food & production environments
Characterize community variation in foods and production settings. Profiling can support research and monitoring questions; it does not by itself certify food safety or regulatory compliance.
Biotechnology & fermentation
Track community composition in bioreactors and fermentation systems to investigate process variation and generate hypotheses about microbial contributions.
Biomedical research
Study community associations with disease status, treatment or other host variables. Results support research interpretation and are not a standalone clinical diagnosis.
Animal & plant microbiomes
Investigate host-associated communities across tissues, developmental stages or environments, with methods and comparisons adapted to the sampling design.
Starting your project
Data, markers and sample information
Raw reads or processed tables
Provide demultiplexed FASTQ/FASTQ.gz reads, or suitable ASV/OTU count tables with taxonomy, representative sequences where available and processing history. Existing tables enter at the appropriate downstream stage.
Marker & sequencing details
Tell us the marker and amplified region, primer sequences, platform and single-end or paired-end layout. Full-length 16S and other long-read datasets require a platform-specific assessment before agreeing the workflow.
Sample metadata & comparisons
Supply a sample sheet linking file names to sample IDs, groups, sites, batches and relevant covariates. Include biological replication, repeated measurements and the questions you want to test.
Controls & reference information
Include extraction blanks, PCR negatives or mock communities if sequenced, and explain any filtering already performed. Share required reference databases and versions so results can be interpreted consistently.
Analytical workflow
Microbiome Data Analysis Workflow
The workflow is adapted to your marker, platform and starting files. Each step can be expanded for more detail.
01 · Project & data review
Confirm markers, samples and comparisons
View step details
Review primers, read layout, sample metadata, controls and the intended comparisons. Check whether the study design supports the requested statistical questions.
02 · Quality & primer processing
Prepare reads for the selected workflow
View step details
Inspect read quality and remove primers or adapters as needed. Filtering and paired-read overlap requirements depend on the marker and platform; ITS length variation needs appropriate handling.
03 · Feature inference & taxonomy
Build the feature and taxonomy tables
View step details
Denoise suitable reads, remove chimeras and assign taxonomy using the selected reference. Review read retention, non-target assignments and evidence from controls. Existing ASV/OTU tables can bypass raw processing.
04 · Diversity & ordination
Explore community structure
View step details
Select within-sample metrics and between-sample distances, assess sequencing depth and visualize community patterns. Choose transformations or subsampling according to the analysis rather than applying one procedure to every output.
05 · Statistical comparisons
Evaluate groups and metadata associations
View step details
Use tests suited to the data and sampling design, with multiple-testing correction where appropriate. Community comparisons consider dispersion; repeated sampling requires suitable models or restricted permutations.
06 · Reporting & interpretation
Deliver organized outputs and findings
View step details
Prepare agreed figures, tables and a report documenting tools, references and analytical choices. Explain the findings in context and identify useful follow-up questions.
Project outputs
Microbiome Analysis Deliverables
The agreed scope defines your outputs. Raw sequencing files originate with your sequencing provider; the deliverables below describe the analysis results.
Quality & processing summaries
Read-retention and filtering summaries for projects starting from FASTQ, with relevant observations about controls, non-target sequences and data limitations.
Feature & taxonomy tables
ASV counts and representative sequences for applicable raw-read workflows, or reviewed input OTU/ASV tables. Include taxonomy and clearly labelled relative-abundance summaries where requested.
Diversity & community results
Selected diversity metrics, distance-based analyses and ordination outputs, with methods and sample exclusions explained.
Statistical comparison tables
Results for agreed group comparisons and metadata associations, including differential abundance where supported by the design and scope.
Publication-ready figures
Composition plots, diversity comparisons, heatmaps and ordination figures in agreed formats such as SVG, PNG or PDF, with consistent sample labels.
Report & methods documentation
A summary report with tools and reference versions, key parameters, findings and limitations. Outputs are linked to the supplied sample metadata; additional scripts or intermediate files can be agreed.
Published research
Experience in salivary mycobiome analysis
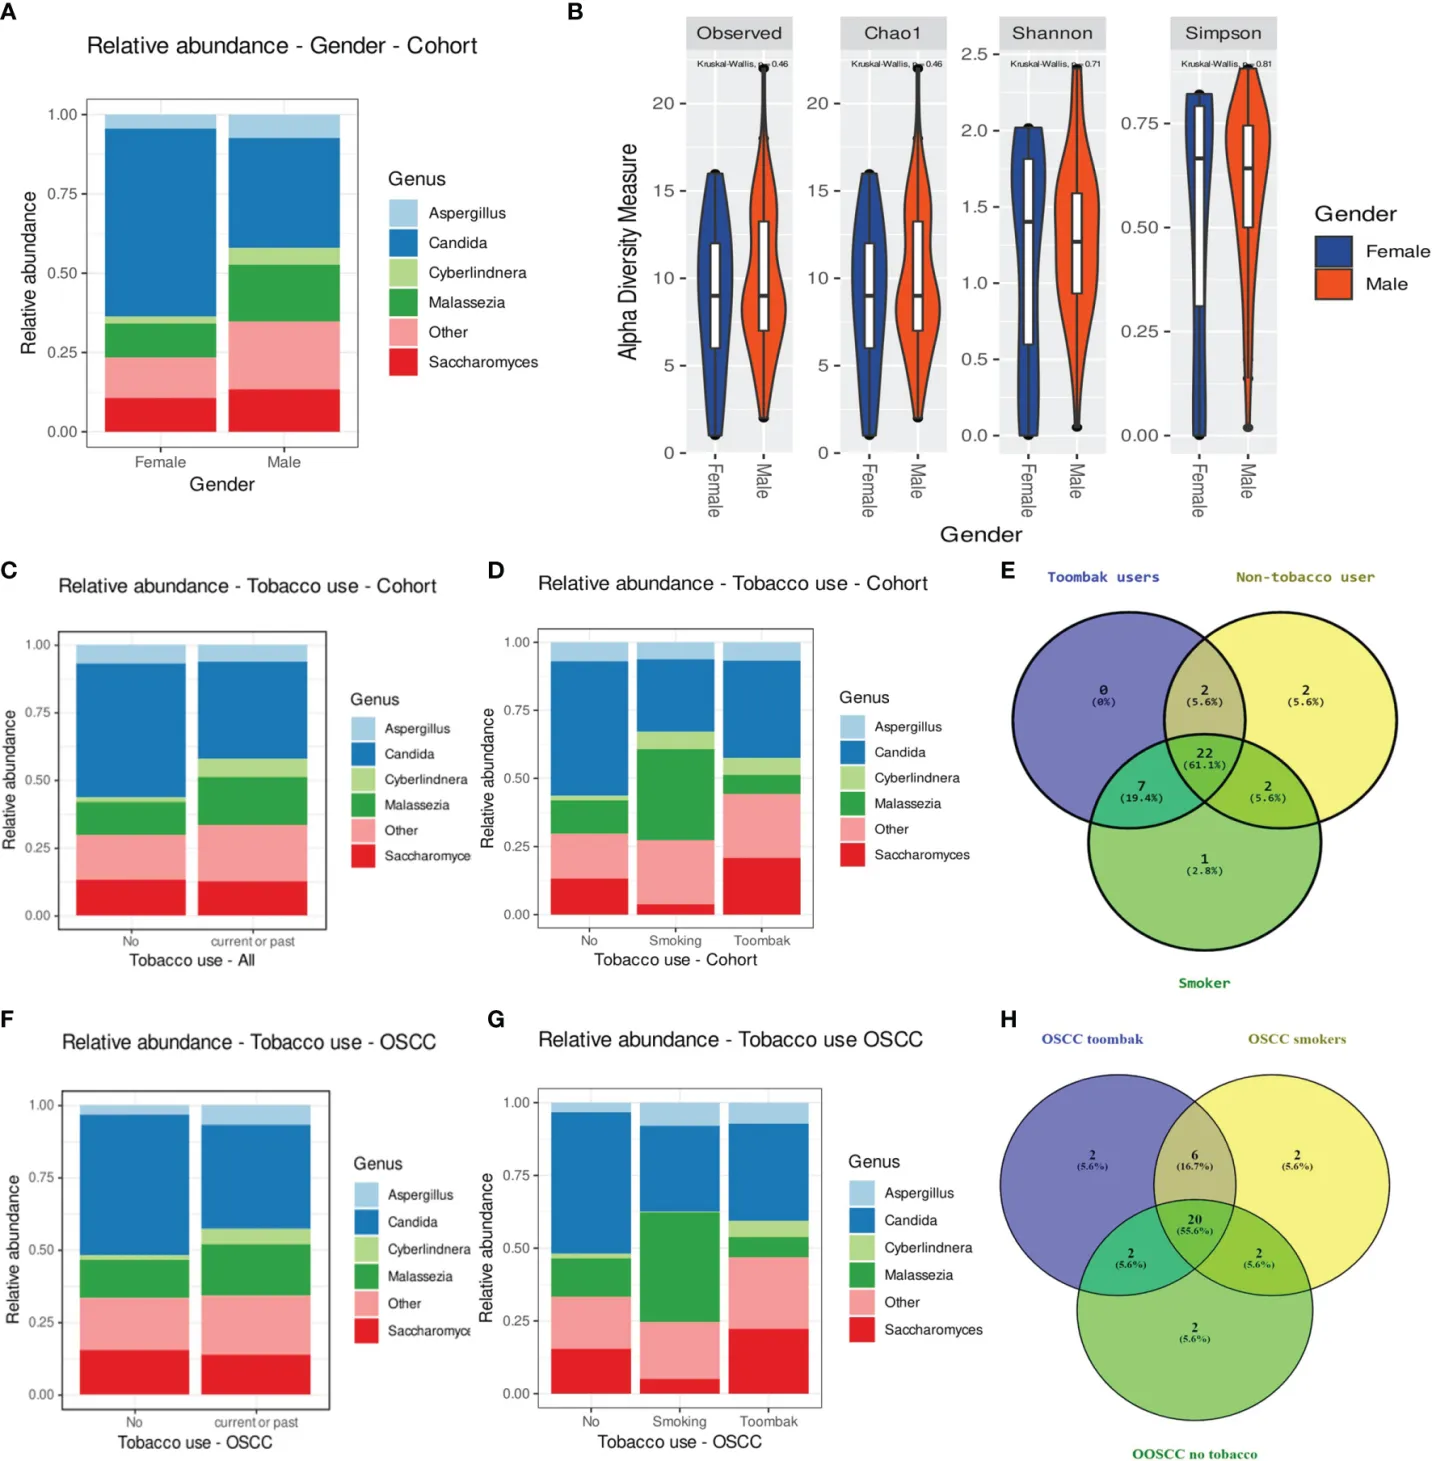
Rubén Javier-López co-authored this study of salivary fungal communities. The figure illustrates several outputs relevant to microbiome profiling. Select the image to view it at full size.
Working with Tailoredomics
Why choose our microbiome data analysis services?
Research experience
Microbiological expertise and experience contributing to published mycobiome research inform the analysis and interpretation.
Methods suited to your study
Marker, primers, controls, sample relationships and the research question guide analytical choices.
Transparent outputs
Receive organized results and documented methods, with clear explanations of evidence and limitations.
Direct communication
Discuss your project with the scientist doing the analysis. Scope, cost, timing and custom outputs are agreed before work begins.
Before you enquire
Frequently asked questions
Do you perform sequencing, DNA extraction or library preparation?
No. We provide downstream bioinformatics for existing data. Your institution or sequencing provider handles sample preparation and sequencing.
Which markers and data formats do you accept?
We analyse 16S, 18S and ITS amplicon data in suitable FASTQ formats, and can assess processed ASV/OTU tables for downstream analysis. Tell us the platform, primers and read layout; long-read and full-length marker projects are assessed separately.
Does this service cover shotgun metagenomics?
Microbiome analysis can use several sequencing approaches. This page focuses on marker-gene amplicons. For shotgun community profiling, functional annotation or genome recovery, see our metagenomics services.
Can you always identify species or measure absolute abundance?
No. Taxonomic resolution depends on the marker region, sequencing quality and reference database. An ASV is a sequence feature, not automatically a species. Relative sequence abundance does not directly measure cell numbers; absolute quantification needs additional suitable measurements or experimental standards.
Do diversity results show whether a microbiome is healthy?
Diversity and composition describe aspects of a community. Their meaning depends on the biological system and study context; higher diversity is not universally healthier, and profiling alone cannot diagnose dysbiosis or disease.
Which tools and reference databases do you use?
Tools can include DADA2, phyloseq, mia and MicrobiomeAnalyst, with references selected for the marker. SILVA and UNITE are examples. Existing projects using Greengenes can be reviewed with their database version and processing history; continuity with an older analysis is assessed explicitly.
Can you analyse existing tables or make custom comparisons?
Yes. Share the count table, taxonomy, metadata and processing history. We assess what can be supported by those files, including group comparisons, selected figures or metadata associations. Raw-read quality checks cannot be reconstructed from an abundance table alone.
How long does analysis take and what will I receive?
Timing and price depend on the number of samples, starting files and requested analyses. We agree the schedule and outputs after reviewing your project; these can include feature tables, taxonomy, diversity results, statistical comparisons, figures and a report.
Further reading
Microbiome profiling and diversity
Understanding microbiome profiling
What Is Microbiome Profiling? A Practical Guide — an introduction to studying microbial communities.
Alpha and beta diversity
Alpha and Beta Diversity in Microbiome Studies Explained — understand within-sample diversity and differences between communities.
Microbiome and microbiota
Microbiome vs Microbiota: What’s the Difference? — clarify these related terms.
Discuss your project
Need help analysing your microbiome dataset?
Tell us about your samples, marker, available files and research question. We can define an analysis plan and quotation for a complete workflow or selected steps.