
Proteomics bioinformatics services
Proteomics Services: Extract Biological Insight from Mass Spectrometry Data
From protein abundance tables to differential abundance, functional interpretation and publication-ready figures. Tailored analysis for microbial systems, host–microbe studies and multi-omics research.
We analyse existing proteomics data. Sample preparation and mass spectrometry acquisition are arranged separately; raw-file processing is assessed before agreeing the scope.
Analysis capabilities
Our Proteomics Data Analysis Services
Choose a complete analysis or selected steps for an existing dataset. Starting files, comparisons and deliverables are agreed before work begins.
Data quality assessment & filtering
Review identification confidence, contaminants, sample distributions and missing values. Assess the quality information available in your processed results, and define filtering appropriate to the experiment.
Peptide & protein identification
Where raw processing is included, agree a compatible search workflow and protein reference database, such as UniProt or RefSeq. We assess outputs from tools such as MaxQuant and Proteome Discoverer in the context of their search settings and protein grouping.
Quantification & differential abundance
Analyse label-free or label-based quantitative results using methods suited to the acquisition and experimental design. Review normalization, missingness and biological replication, then report abundance changes and statistical uncertainty for agreed contrasts.
Functional & pathway enrichment
Explore biological patterns using Gene Ontology, KEGG or Reactome where organism coverage supports them. Document the identifiers, tested background and interpretation limits; enrichment supports hypotheses about biological responses.
Multi-omics & network analysis
Integrate protein abundance with transcriptomics or genomics results where samples and identifiers can be matched. Use functional association networks to explore related features and prioritize follow-up questions.
Reporting & visualizations
Receive clear result tables, heatmaps, PCA plots, volcano plots and other agreed figures, with a summary report explaining the methods, key findings and limitations.
Research outcomes
What can you achieve with our proteomics services?
Compare protein abundance
Identify proteins or protein groups with supported abundance differences between conditions, treatments or time points. Interpret effect sizes alongside uncertainty and data coverage.
Explore biological pathways
Relate changing proteins to functions and pathways relevant to your organism. Generate hypotheses about stress responses, nutrient use or host–microbe biology.
Connect RNA and protein evidence
Compare transcript and protein responses to identify concordant patterns and differences worth investigating. Protein abundance does not directly measure enzymatic activity or prove a regulatory mechanism.
Prioritize candidates for follow-up
Use statistical results, annotations and biological context to select candidate proteins for further experiments. Biomarker performance and protein function require appropriate validation.
Starting your project
Data and supported organisms
Processed results & abundance tables
Share protein or peptide abundance tables and associated search reports, including identifiers, confidence measures and processing history. MaxQuant and Proteome Discoverer outputs are examples; a small representative export helps us assess compatibility.
Raw data & acquisition details
If you need raw processing, tell us the instrument, file format, acquisition approach and labelling strategy. Formats such as Thermo RAW files or mzML are assessed with the required software and reference database before acceptance.
Metadata & study design
Provide sample groups, biological and technical replicates, batches, relevant covariates and requested comparisons. Include the organism, reference database and any analysis already performed.
Organisms & biological systems
Our focus is microbial proteomics, including bacteria, archaea and fungi. Host or other eukaryotic datasets can be assessed. Host–microbe and community proteomics require suitable references and careful handling of shared peptides and ambiguous assignments.
Start with your research question, sample number and file types. You do not need to upload raw files with your first enquiry.
Analytical workflow
Proteomics Data Analysis Workflow
Projects enter at the stage appropriate to their starting data. The workflow covers downstream bioinformatics; mass spectrometry acquisition is arranged separately.
01 · Project & input review
Define the question and starting files
View step details
Review study design, metadata, acquisition details and processing history. Agree contrasts, references, feasibility and outputs. Sample preparation and instrument acquisition take place with your chosen provider.
02 · Identification & quality review
Assess the evidence behind the tables
View step details
Review search confidence, contaminants, protein groups and quality summaries. Perform raw-file processing only when included in the agreed scope and supported by a suitable workflow.
03 · Quantification & preprocessing
Prepare abundance data for analysis
View step details
Inspect distributions, sample relationships and missing values. Select filtering, transformation and normalization suited to the data. Missing-value treatment is chosen for the analytical method and observed missingness.
04 · Statistical comparisons
Evaluate differential protein abundance
View step details
Fit models and evaluate agreed contrasts using the available biological replication and design information. Report effect sizes, multiple-testing-adjusted results and relevant limitations.
05 · Functional interpretation
Explore pathways and associations
View step details
Map identifiers to appropriate annotations and evaluate enrichment where supported. Network analysis and integration with other omics can be included when they answer the project question.
06 · Reporting & discussion
Deliver tables, figures and interpretation
View step details
Organize results by comparison and sample metadata. Document methods and analytical choices, prepare agreed figures, and discuss the findings and useful next steps.
Project outputs
Proteomics Analysis Deliverables
Your quotation specifies the files and analyses included. Outputs depend on whether we start from raw data, processed tables or existing statistical results.
Quality & processing summary
Relevant quality checks, filtering decisions and preprocessing summaries, with the available identification and quantification information explained.
Protein abundance & annotation tables
Organized CSV/TSV tables with feature identifiers, abundance values and available annotations. Distinguish supplied, filtered and normalized measurements and document protein-group handling.
Differential abundance results
Tables for the agreed contrasts, including effect sizes, p-values, adjusted p-values and stated decision criteria where the statistical method provides them.
Functional & network outputs
Where included: enrichment tables, annotation sources, analysis backgrounds and functional association networks. Multi-omics summaries are supplied for the agreed integration scope.
Publication-ready figures
Suitable PCA plots, heatmaps, volcano plots and pathway summaries in agreed formats such as SVG, PNG or PDF. Labels and comparisons follow your study design.
Report & methods documentation
A summary report explaining methods, software and database versions, findings and limitations. Search outputs, intermediate files or analysis scripts can be included by agreement. Dataset preparation and support for PRIDE submission can also be included by agreement.
Published research
Connecting proteomics and transcriptomics in Fervidobacterium
Research by Rubén Javier-López and co-authors examined feather keratin degradation using both omics approaches. This published example shows how a network can place changing features in a functional context.
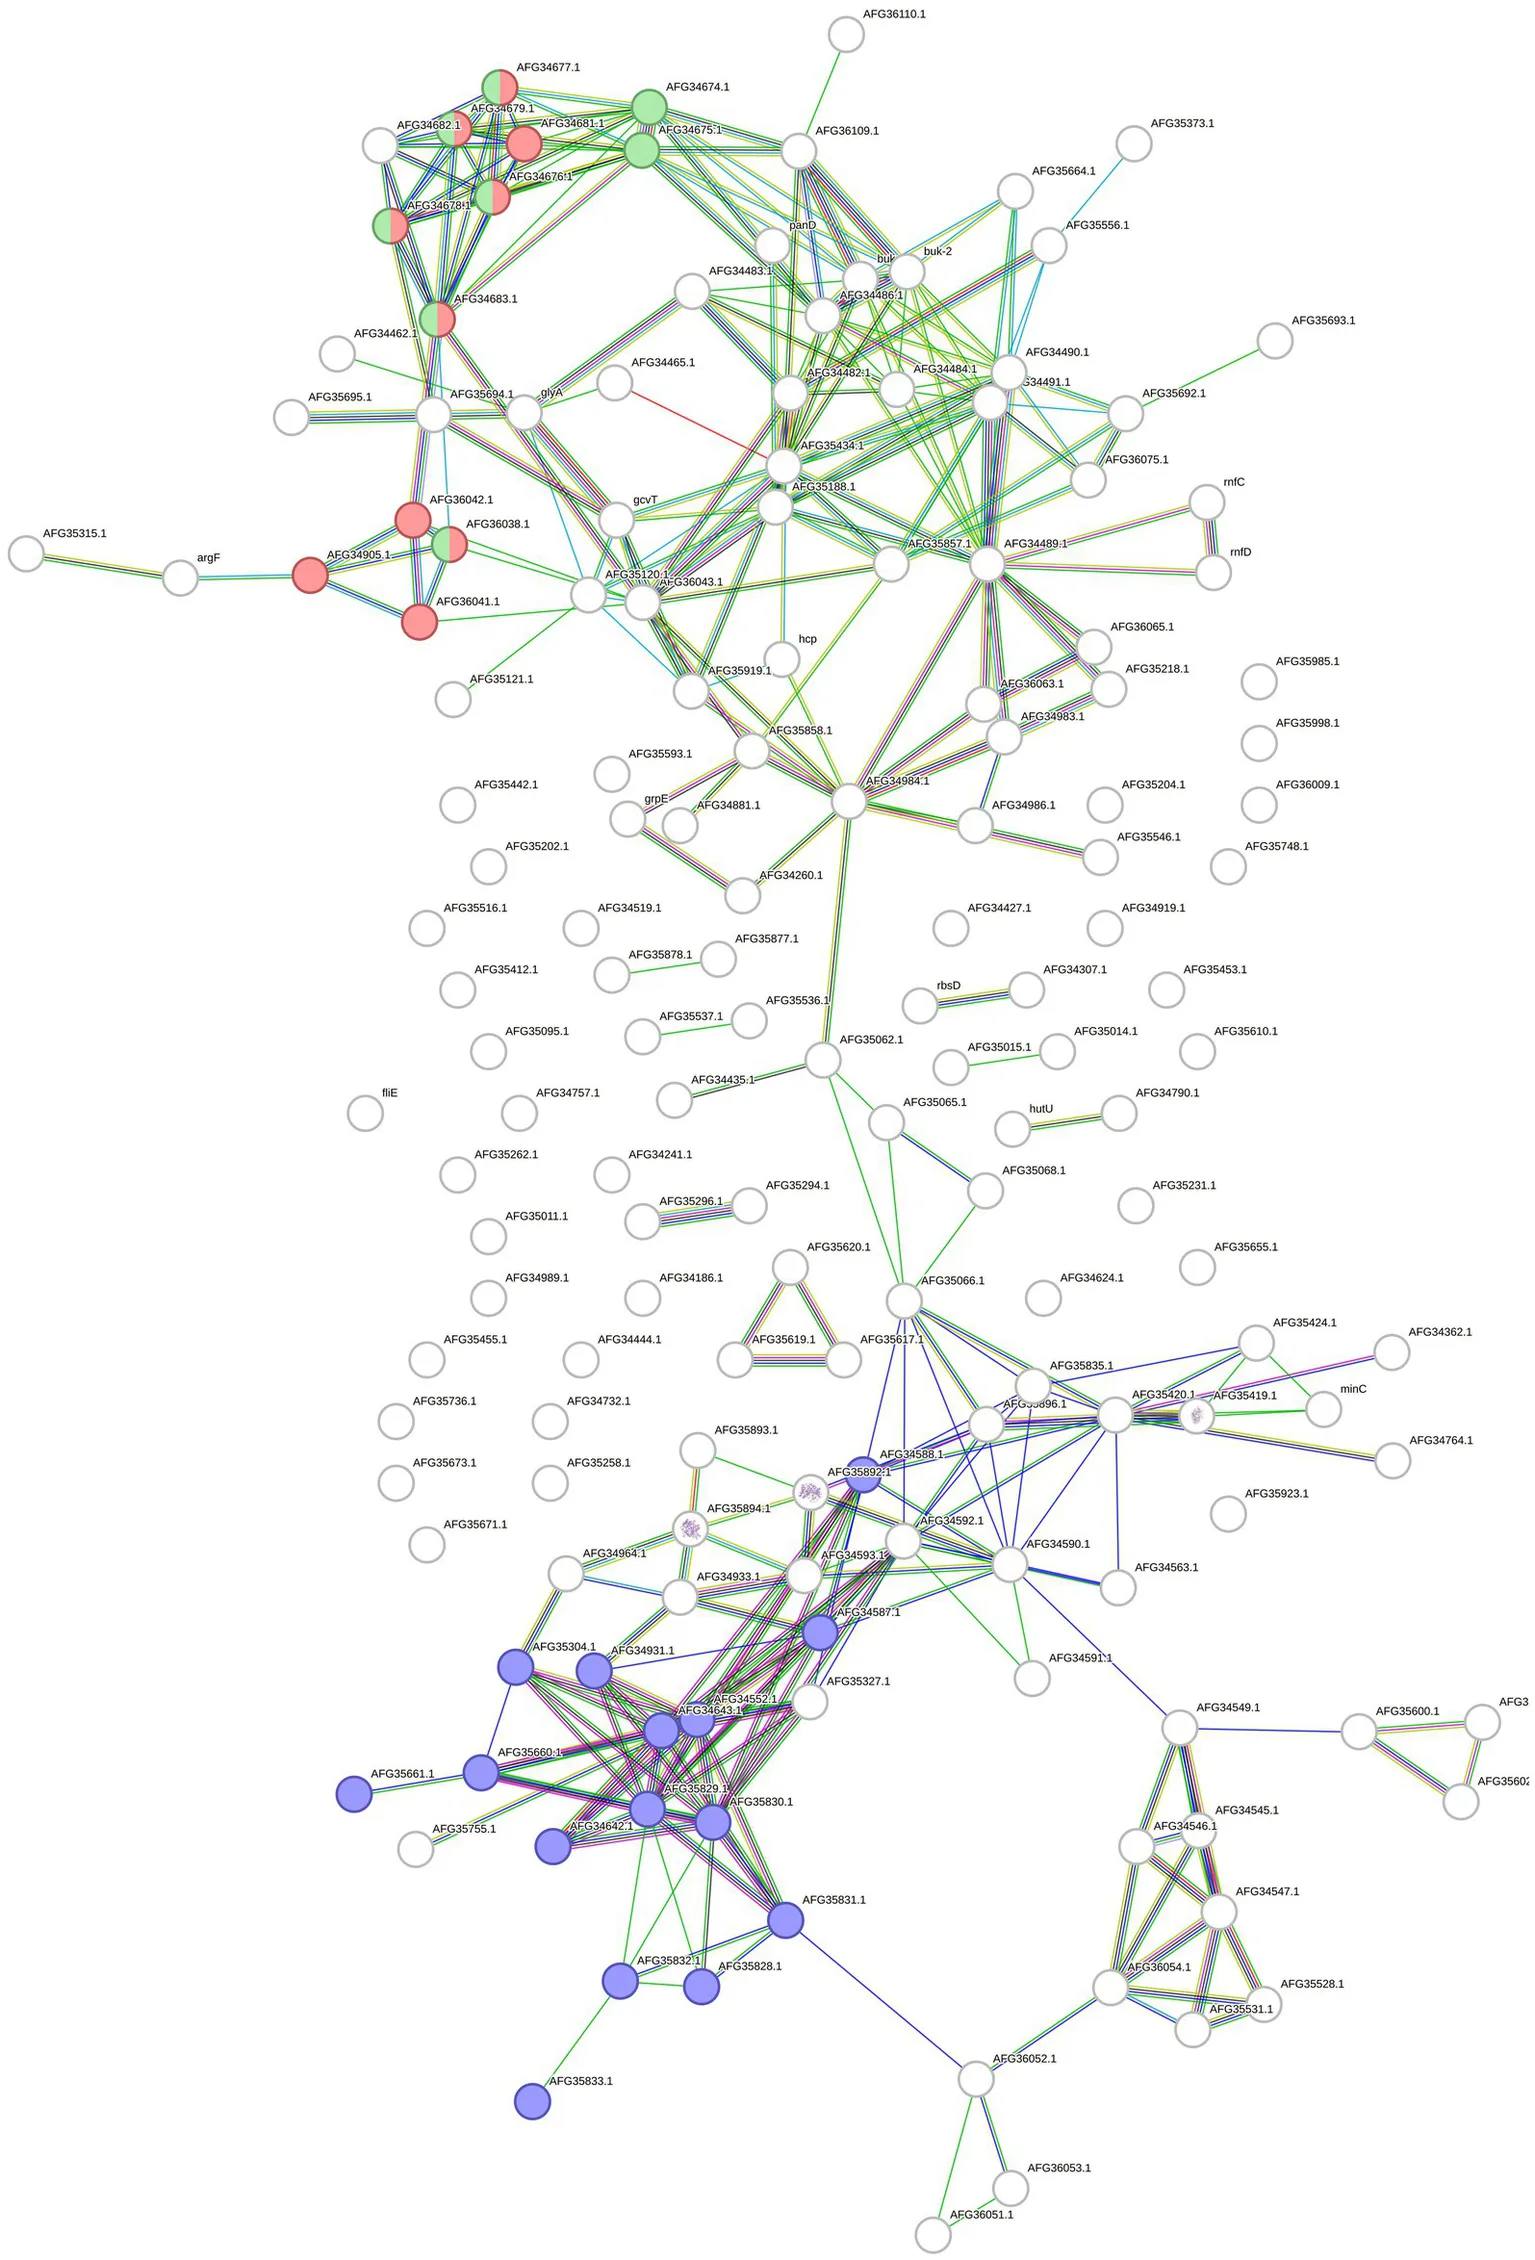
Red and green features relate to lysine degradation; blue features relate to extracellular solute binding. The connections represent STRING associations and do not necessarily indicate direct physical interactions. Select the image to view it at full size.
Working with Tailoredomics
Why choose our proteomics bioinformatics services?
Microbial research experience
Biological interpretation informed by research on microbial physiology and integrated proteomic and transcriptomic responses.
Analysis shaped around your question
Agree comparisons, reference resources and priorities around your organism, available data and experimental design.
Transparent analytical choices
Receive organized outputs and documented decisions about filtering, normalization, statistics and interpretation.
Direct communication & agreed timing
Discuss the analysis with the scientist doing the work. Scope, cost and timing are agreed for your dataset, with updates during the project.
Research contexts
Applications of proteomics analysis
Microbial physiology & environmental responses
Investigate abundance changes associated with nutrient use, temperature, pollutants or other stresses. Functional annotation can help prioritize hypotheses for poorly characterized proteins.
Host–microbe studies
Examine host or microbial protein responses where the data and reference coverage support them. Joint datasets require careful assignment of shared and organism-specific evidence.
Experimental models & treatment responses
Compare protein abundance across treatments, growth conditions or time points using contrasts supported by the study design.
Systems biology & multi-omics research
Combine proteomics with other available molecular measurements to explore complementary biological evidence. Integration depends on sample matching, identifiers and the question being addressed.
Before you enquire
Frequently asked questions
Can you help submit my proteomics data to PRIDE?
We can help prepare your proteomics dataset for submission to PRIDE through ProteomeXchange, including organizing data files, reviewing sample and experimental metadata, and supporting the submission process. Repository submission support is agreed as part of the project scope and depends on access to the necessary raw files, processed results and study information. Read our guide to submitting proteomics data to PRIDE.
Do you perform mass spectrometry or sample preparation?
No. Tailoredomics provides downstream proteomics bioinformatics. Arrange protein extraction, sample preparation and instrument acquisition through your core facility or chosen provider, then share the agreed data files.
What proteomics data can I submit?
Processed protein or peptide tables with their search reports and metadata are a useful starting point. Raw instrument files or mzML can also be assessed when raw processing is needed. We confirm compatibility, acquisition details, software requirements and the reference database before agreeing that work.
Do you analyse label-free and labelled quantitative data?
Both can be considered. Tell us the acquisition method, labelling strategy and software used to produce the abundance tables. The analysis and supported outputs are agreed for that dataset; file format alone does not establish compatibility.
Which organisms are supported?
Our main focus is microbial systems, including bacteria, archaea and fungi. Host and other eukaryotic datasets can also be assessed. For mixed-organism or community data, feasibility depends on the references, peptide evidence and requested biological comparisons.
How do you handle missing values, normalization and batch effects?
We inspect sample distributions, missingness and the study design before selecting a method. Imputation is not applied automatically to every missing value. Batch variables can be modelled when the design supports their estimation; a completely confounded batch and treatment effect cannot be separated by correction alone.
Can you combine proteomics with transcriptomics or genomics?
Yes, where suitable matched data and identifiers are available. We can compare RNA and protein abundance, relate results to genomic annotations and explore functional associations. These comparisons support interpretation without assuming that RNA abundance, protein abundance and protein activity are equivalent.
What will I receive, and can you help interpret it?
The agreed outputs can include abundance and statistical tables, functional results, figures and a report describing methods and findings. We discuss the key results and limitations; custom visualizations or additional interpretation can be scoped with the project.
How long does analysis take and what does it cost?
This depends on sample number, starting files, reference availability and the analyses requested. Share your dataset outline and deadline so we can propose a scope, quotation and realistic schedule.
Related analyses
Related services and resources
Transcriptomics & RNA-seq
Transcriptomics & RNA-Seq Data Analysis Services — connect protein abundance with transcript-level responses.
Metagenomics
Metagenomics Bioinformatics Services — discuss how community genomic information could support a metaproteomics project.
Microbial genomics
Microbial Genomics Services — obtain genome annotations and comparative context for microbial protein data.
Microbiome analysis
Microbiome Data Analysis Services — explore community composition alongside other molecular measurements.
Proteomics examines proteins in a biological system. For an introduction to the topic, read what is proteomics?
Discuss your project
Need help analysing your proteomics dataset?
Tell us about your organism, sample groups, available files and research question. We can propose an analysis plan for a complete project or selected downstream steps.